
我家產品HappyStyle開發到尾聲,需求上的功能已全數完成,接下來的時間可以來優化各個功能。若想要讓使用者體驗 (User Experience)變得更優,那麼勢必要提升App運作的流暢度。
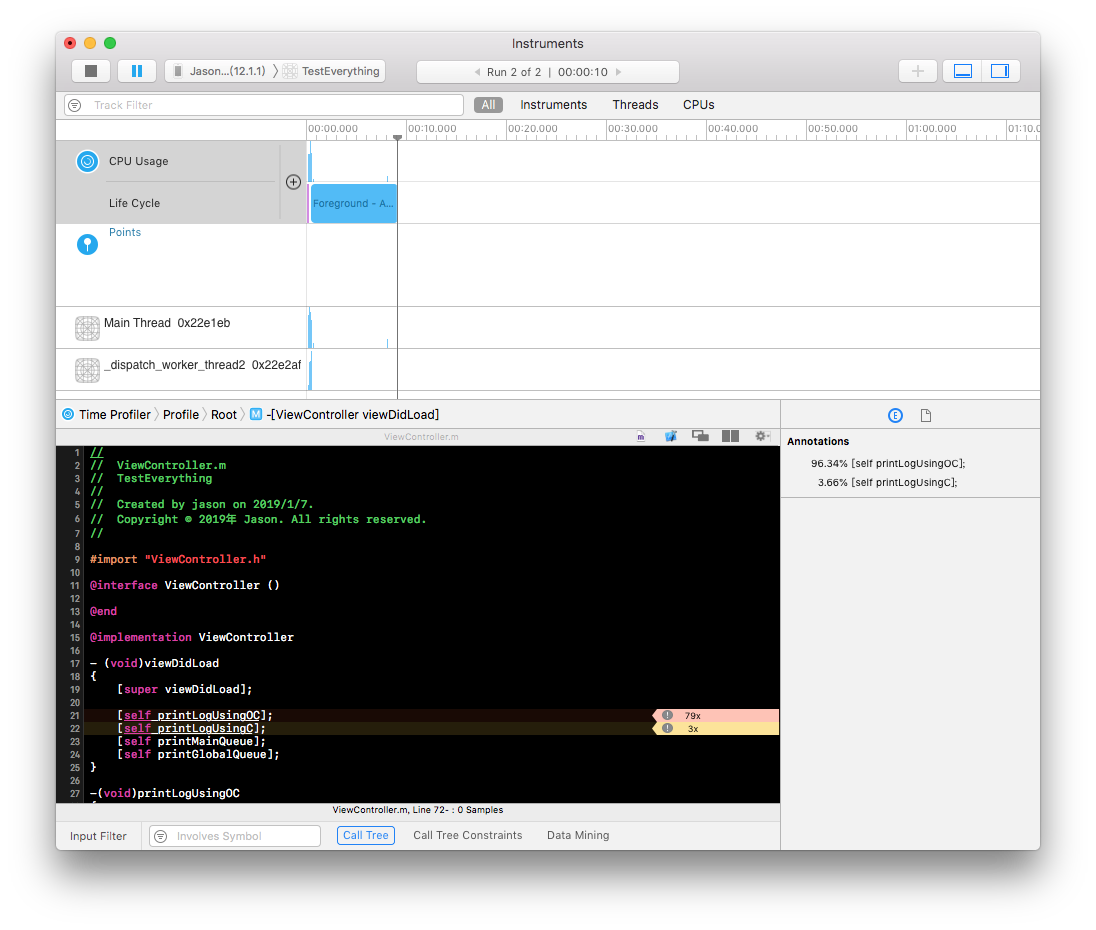
像是在滑內容清單,若能無「卡頓」現象會是優良的體驗,那麼如何來減少卡頓狀況?我們可以利用Xcode內建的工具Time Profiler (時間分析器),顧名思義就是利用它來分析各個方法 (Method)或函式 (Function),所執行的時間狀況會在界面上清楚呈現,除了可以觀察自訂的也能探索內建的。

操作步驟:
- 選擇要調適的App,在這裡最好使用真機運行應用。
- 點擊按鈕打開並監聽App。
- 設置監聽結果的顯示方式,通常只需要勾選Separate by Thread、Hide System Libraries。
Separate by Thread:監聽結果按照線程劃分。
Hide System Libraries:勾選此項你會顯示你App的代碼,這是非常有用的。因為通常你只想關心CPU花在自己代碼上的時間不是系統上的。
Invert Call Tree:從上倒下跟踪堆棧,這意味著你看到的表中的方法,將已從第0幀開始取樣,這通常你是想要的,只有這樣你才能看到CPU中話費時間最深的方法。也就是說FuncA{FunB{FunC}}勾選此項後堆棧以C->BA把調用層級最深的C顯示在最外面。
Top Functions:一個函數花費的時間直接在該函數中的總和,以及在函數調用該函數所花費的時間的總時間。因此,如果函數A調用B,那麼A的時間報告在A花費的時間加上B花費的時間,這非常真有用,因為它可以讓你每次下到調用堆棧時挑最大的時間數字,歸零在你最耗時的方法。
測試程式碼可以這麼寫:
/**
 Theme: Test Time Profiler
 IDE: Xcode 10
 Language: Objective C
 Date: 108/01/27
 Author: HappyMan
 Blog: https://cg2010studio.com/
 */

- (void)viewDidLoad
{
    [super viewDidLoad];

    [self printLogUsingOC];
    [self printLogUsingC];
    [self printMainQueue];
    [self printGlobalQueue];
}

-(void)printLogUsingOC
{
    double dateStart = CFAbsoluteTimeGetCurrent();
    for (int i = 0; i<10000; i++) { NSLog(@"---->NSLog:%d", i);
    }
    double dateEnd = CFAbsoluteTimeGetCurrent()-dateStart;
    NSLog(@"NSLog timeConsuming = %f", dateEnd);
}

-(void)printLogUsingC
{
    double dateStart = CFAbsoluteTimeGetCurrent();
    for (int i = 0; i<10000; i++) { printf("====>printf:%d", i);
    }
    double dateEnd = CFAbsoluteTimeGetCurrent()-dateStart;
    NSLog(@"printf timeConsuming = %f", dateEnd);
}

-(void)printGlobalQueue
{
    dispatch_async(dispatch_get_global_queue(0, 0), ^{
        double dateStart = CFAbsoluteTimeGetCurrent();
        for (int i = 0; i<10000; i++) { NSLog(@"~~~~>%d", i);
        }
        double dateEnd = CFAbsoluteTimeGetCurrent()-dateStart;
        NSLog(@"forLoopGlobalQueue NSLog timeConsuming = %f", dateEnd);
    });
}

-(void)printMainQueue
{
    dispatch_async(dispatch_get_main_queue(), ^{
        double dateStart = CFAbsoluteTimeGetCurrent();
        for (int i = 0; i<10000; i++) { NSLog(@"****>%d", i);
        }
        double dateEnd = CFAbsoluteTimeGetCurrent()-dateStart;
        NSLog(@"forLoopMainQueue NSLog timeConsuming = %f", dateEnd);
    });
}
Time Profiler iPhone XS Max
Time Profiler iPhone 6

可以看出同樣的條件下,NSLog (Objective C)比printf (C)慢很多。
剛好我手邊有四支不同規格的iPhone,我以出產先後來陳列測試數據:
iPhone 6
NSLog timeConsuming = 0.806157
printf timeConsuming = 0.072821
forLoopMainQueue NSLog timeConsuming = 1.221460
forLoopGlobalQueue NSLog timeConsuming = 1.913152
NSLog timeConsuming = 0.605738
printf timeConsuming = 0.017561
forLoopMainQueue NSLog timeConsuming = 0.742060
forLoopGlobalQueue NSLog timeConsuming = 1.066033
00:00.000.000 Initializing application’s address space and dynamic linking required frameworks took 349.16 ms.
00:00.349.159 Application took 79.01 ms between when UIApplicationMain() or NSApplicationMain() started and when the did-finish-launching notifications finished.
00:02.024.851 Currently running in the foreground…
—
iPhone SE
NSLog timeConsuming = 0.135863
printf timeConsuming = 0.002952
forLoopMainQueue NSLog timeConsuming = 0.245584
forLoopGlobalQueue NSLog timeConsuming = 0.268479
00:00.000.000 Initializing application’s address space and dynamic linking required frameworks took 116.41 ms.
00:00.116.414 Application took 19.15 ms between when UIApplicationMain() or NSApplicationMain() started and when the did-finish-launching notifications finished.
00:00.544.820 Currently running in the foreground…
—
iPhone 8+
NSLog timeConsuming = 0.090414
printf timeConsuming = 0.003238
forLoopMainQueue NSLog timeConsuming = 0.108809
forLoopGlobalQueue NSLog timeConsuming = 0.144815
00:00.000.000 Initializing application’s address space and dynamic linking required frameworks took 194.80 ms.
00:00.194.797 Application took 19.73 ms between when UIApplicationMain() or NSApplicationMain() started and when the did-finish-launching notifications finished.
00:00.474.407 Currently running in the foreground…
—
iPhone XS Max
NSLog timeConsuming = 0.091390
printf timeConsuming = 0.004488
forLoopMainQueue NSLog timeConsuming = 0.107889
forLoopGlobalQueue NSLog timeConsuming = 0.144465
00:00.000.000 Initializing application’s address space and dynamic linking required frameworks took 319.71 ms.
00:00.319.708 Application took 25.37 ms between when UIApplicationMain() or NSApplicationMain() started and when the did-finish-launching notifications finished.
00:00.599.288 Currently running in the foreground…
—
可以看得出來,執行時間跟硬體規格有很大的關係呢!我親愛的iPhone 6已邁入第五年,使用流暢度早已越來越差><~
同樣是把訊息列印在Console上,NSLog (Objective C)和printf (C)差異頗大,畢竟Objective C是以C為基底的物件導向程式語言,實作上肯定會是C的超集合 (Super Set)。

- Red: the set of all programs valid in C, C++, and Objective-C (relatively small)
- Green: the set of all programs valid in C and Objective-C, but invalid in C++ (even smaller)
- Gray: the set of all programs valid in Objective C and C++, but invalid in C (empty, as far as I know)
- Blue: the set of all programs valid only in Objective C (relatively large)
- Yellow: the set of all programs valid only in C++ (largest)
- The set of valid C programs (in red and green) is an strict subset of the set of valid Objective C programs (blue)
實際應用
接下來應用到我們家專案上,發現樂高系統底層可以優化,畢竟至少一半的視覺元件要指定值時會執行該方法,若能在此方法上「動手腳」,肯定會有突破性的進展。

看到Time Profiler有時間長度佔比:
- 53.85%
- 25.00%
我陸續修掉耗時久的寫法⋯⋯


已使用四年歷史我的裝置iPhone 6,優化後效能提升至少10倍呢!因為發明樂高系統的資深丹哥使用高階手機,所以難以察覺效能上的問題。
同事Adam在裝新版本後,發現卡頓現象漸低很多超有感!很高興我幫公司產品提升性能,促進使用者體驗更加完美~
參考:Instruments — Time Profiler使用、Time Profiler 使用、iOS性能優化- 工具Instruments之Time Profiler、What does “Objective-C is a superset of C more strictly than C++” mean exactly?、ios Instruments之Time Profiler、Instruments Tutorial with Swift: Getting Started、WWDC 2016 – Using Time Profiler in Instruments。

隨意留個言吧:)~